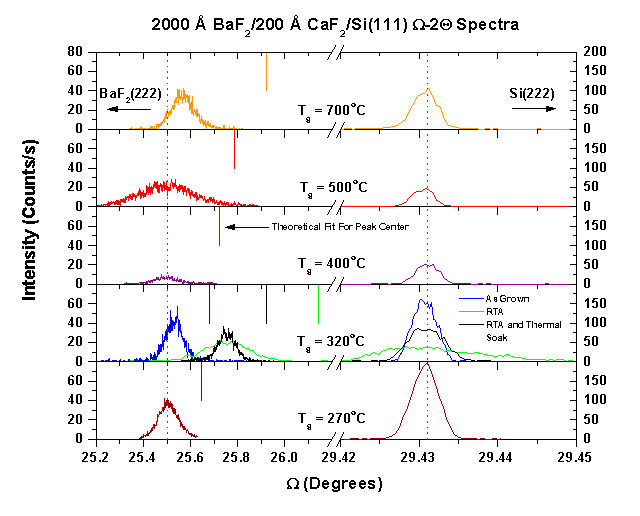
 FIG. 4 (a) X-Ray spectra of MBE grown 200 nm BaF2/20 nm CaF2/Si(111) for different growth temperatures.
The left axis refers to the BaF2 (222) peak while the right axis refers to the Si (222) peak. The two vertical dotted lines refer to the expected positions of the unstrained BaF2 (222) peak (left) and the Si (222) peak (right). The vertical solid lines extending down from the tops of the graphs refer to the expected positions of the BaF2 (222) peaks due to residual strain incorporated from the growth or anneal temperatures assuming the BaF2 layer goes down with its temperature dependent lattice spacing, but subsequently gets "stuck" or "frozen" (due to the Si substrate lattice spacing) upon cool down to room temperature. This analysis was done using a Poisson ratio for BaF2 of 0.343.
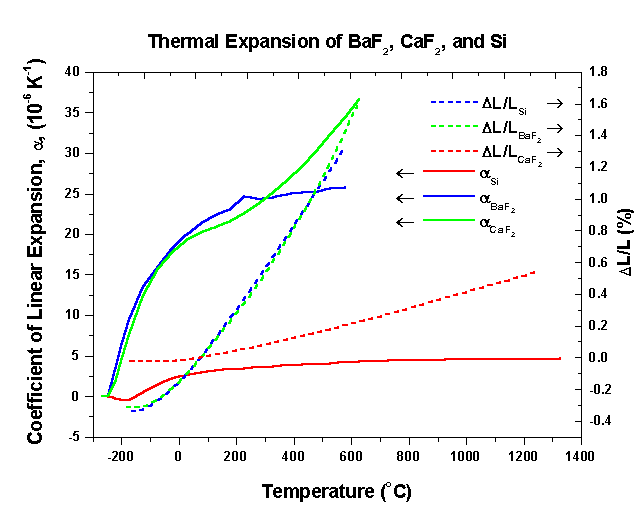
 FIG. 4 (b) Thermal expansion curves for BaF2, CaF2, and Si as a function of temperature.
The left axis shows the coefficient of linear expansion, a, as a function of temperature for the three different materials while the right axis shows the linear expanion, DL/L, as a function of temperature for the three different materials. The data for the curves was obtained from the Thermophysical Properties of Matter Volume 13: Thermal Expansion of Nonmetallic Solids , Y. S. Toulokian et. al. IFI/Plenum, 1976. (c) BaF2 (222) and Si (222) peak separation for the samples grown at different temperatures. The horizontal dotted line is the theoretical peak separation assuming unstrained BaF2.
 FIG. 4 (a) X-Ray spectra of MBE grown 200 nm BaF2/20 nm CaF2/Si(111) for different growth temperatures.
 FIG. 4 (b) Thermal expansion curves for BaF2, CaF2, and Si as a function of temperature.