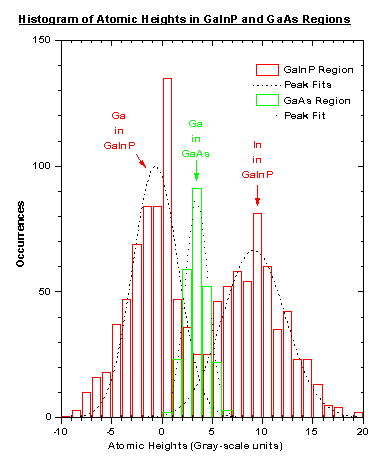
 Fig. 4: Histogram of the gray-scale values of Group III atoms.
Red (green) open bars are for the GaInP (GaAs) region. Note the clear bimodal distribution of the GaInP region compared to the single peak of the GaAs region. The FWHM widths of the peaks are: 5.3 for Ga in GaInP, 7.4 for In in GaInP and 2.7 for Ga in GaAs. The wider peaks for the ternary are expected because of the statistical variation of the nearest group III neighbors.