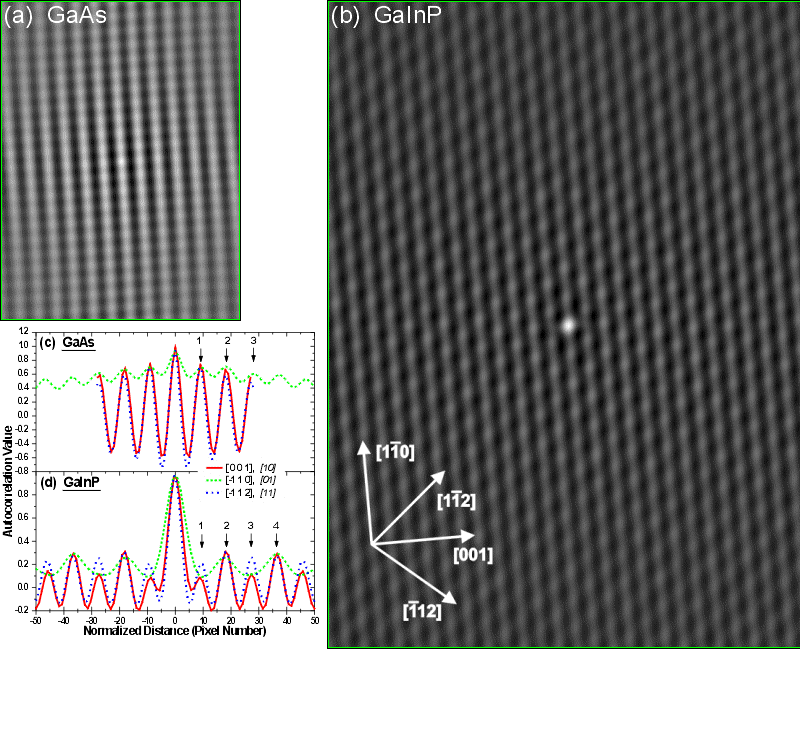
 Fig. 5: Autocorrelation images of the GaAs(a) and GaInP (b) regions of Fig. 4 with associated line cuts (c) and (d).
(a) and (b) both show the usual central peak. The GaAs autocorrelation shows an array of periodic peaks indicating the uniform periodic atoms in image 4(b) while the GaInP autocorrelation only shows several peaks close to the central peak. The periodicity of the peaks are very different in the two cases as shown by the line scans drawn through the central peak in the directions repesenting the [ 0 0 1], [-1 1 0], and [-1 1 2] crystallographic directions shown in (c) and (d). The GaAs line scans show peak heights which slowly decrease from the central peak indicating high periodicity in these directions. The GaInP line scans show peak heights strongly alternating in size in the [ 0 0 1] direction but not in the [-1 1 2] direction. This is indicative of a tendency of the In or Ga to order in the [-1 1 2] and [ 1-1 2] directions.
[Click on figure to enlarge] Fig. 5: Autocorrelation images of the GaAs(a) and GaInP (b) regions of Fig. 4 with associated line cuts (c) and (d).
(a) and (b) both show the usual central peak. The GaAs autocorrelation shows an array of periodic peaks indicating the uniform periodic atoms in image 4(b) while the GaInP autocorrelation only shows several peaks close to the central peak. The periodicity of the peaks are very different in the two cases as shown by the line scans drawn through the central peak in the directions repesenting the [ 0 0 1], [-1 1 0], and [-1 1 2] crystallographic directions shown in (c) and (d). The GaAs line scans show peak heights which slowly decrease from the central peak indicating high periodicity in these directions. The GaInP line scans show peak heights strongly alternating in size in the [ 0 0 1] direction but not in the [-1 1 2] direction. This is indicative of a tendency of the In or Ga to order in the [-1 1 2] and [ 1-1 2] directions.