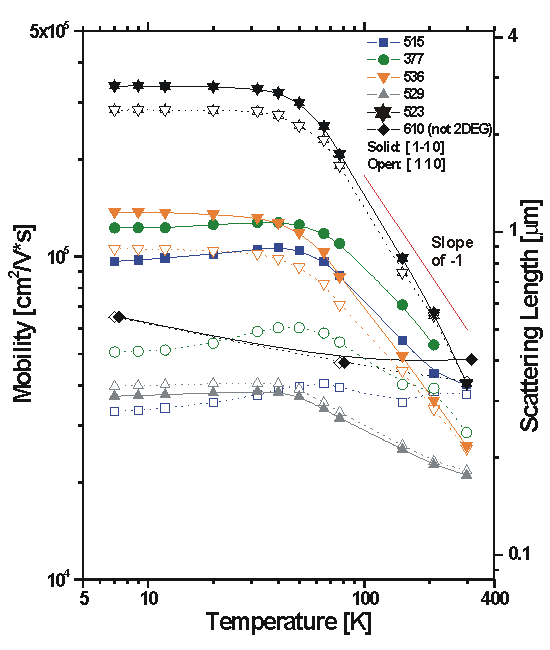
Figure 4 shows the electron mobility for several different quantum well samples versus temperature. The mobility in the [110] and [1-10] directions are shown by open and solid symbols, respectively. The quantum well samples show, to varying degrees, the increase in mobility for a reduction in temperature of the form expected for remotely-doped quantum-well samples. For temperatures from 300 to 77 K the increase in mobility results from the reduction in the effects of phonon scattering, while the saturation observed for still lower temperatures corresponds residual effects of impurities and structural defects. At 7K large discrepancies in the mobility in the [1-10] and [110] directions are observed for two samples with moderate mobility (S523 and S515). The higher mobility is observed in the [1-10] direction. Little anisotropy is observed for the low mobility quantum well and bulk film (S529 and S610, respectively).

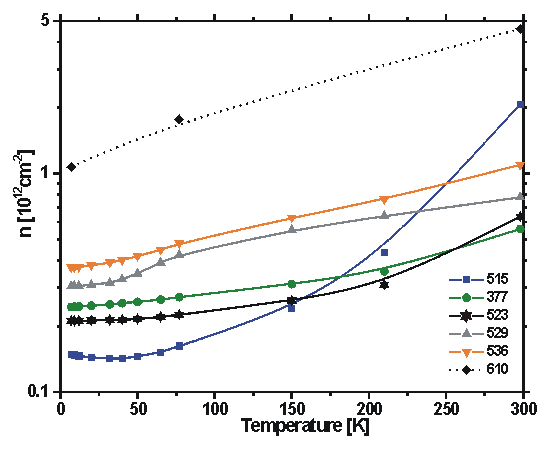
Electron density described here.

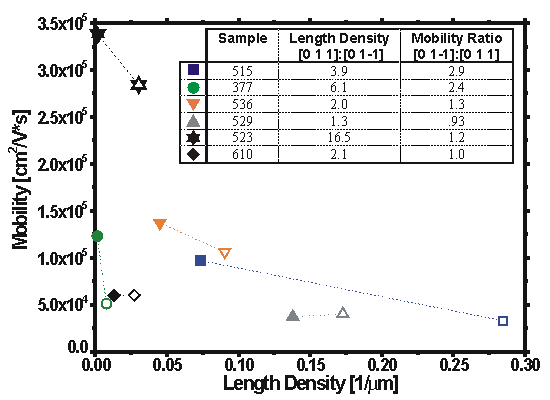
Electron mobility is expected to be higher in the direction corresponding to fewer OASs running perpendicular to the current direction. Figure 4c shows this to varying degrees depending on the sample.