Figure 2: AFM images and associated linescans.(a), (c), and (e) are non-contact AFM images of the surface of sample S523, S515 and S529, respectively. All the images were taken with a Si high-frequency tip with aspect ratio of 3:1. The image sizes are 10mm x 10mm and the gray-scale ranges 17, 17, and 60 nm, respectively. (b), (d) and (f) Linecuts across hillock, oriented-abrupt step and square features, respectively.
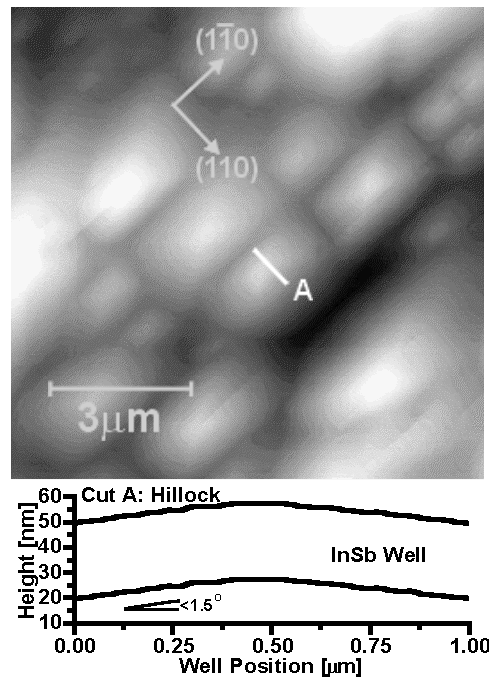 Figure 2(a) shows the surface of S523, the highest mobility sample. The image shows many pyramidal features or hillocks. These hillocks are spiral structures that grow around a threading dislocation indicating that the layers are grown in a Burton-Cabrerra-Frank (BCF) mode. Note that they are elongated in the [ 1-1 0] direction indicating that the diffusion length is longer in this direction, as expected by the presence of continuous channels in the surface reconstruction. Fig 2(b) shows a linecut across one of these hillocks. The angle of inclination is very shallow, typically less than about 1.5°.
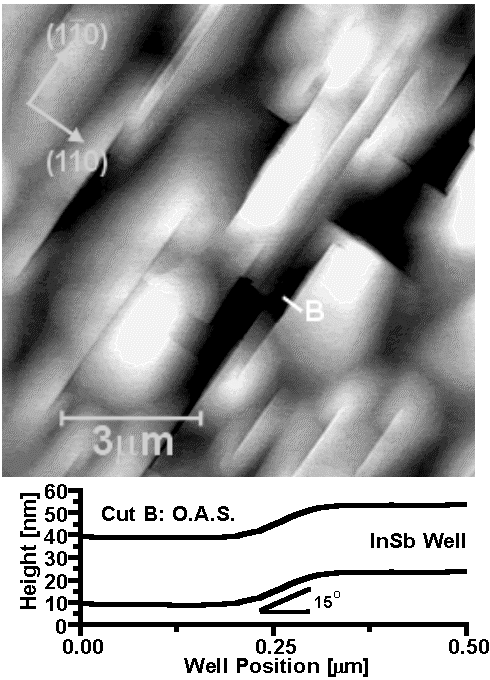 Figure 2(c) shows the surface of S515, a sample that shows the most anisotropic mobility. The image shows oriented abrupt steps (OAS) in the [110] and [1-10] directions in addition to the hillocks. These steps always run between threading dislocations and typically end on the top of a hillock. Typically the OASs in the [ 1-1 0] direction are more numerous and longer. Fig 2(d) shows a linecut across one of these steps showing an abrupt angle of inclination of 15°. Angles across OASs up to 50o are often observed.
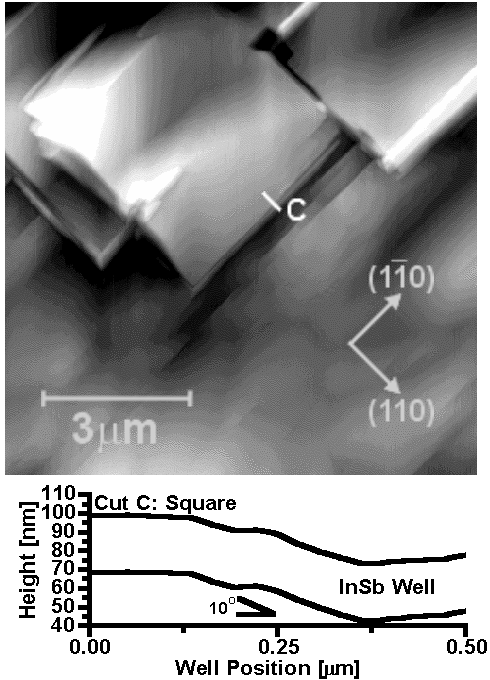 Figure 2(e) shows the surface of S529, a sample that shows poor mobility and little anisotropy. The image shows square mounds with edges in the [110] and [1-10] directions in addition to hillocks and OASs. These squares show only a slight difference in shape in the [110] and [1-10] directions. Fig 2(f) shows a linecut across the edge one of these squares showing an abrupt angle inclination of about 10o.