InSb MQW - FTIR
Fourier transform infrared spectroscopy (FTIR) has been used to determine the energy
of the excitonic transistions in the MQW samples.
While the raw FTIR absorption spectra represent the density-of-states in the material
and show 'steps' above the band gap as new occupational energies are examined,
the exitonic states of the system lie very close in energy to these band transitions and are
difficult to fully analyse.
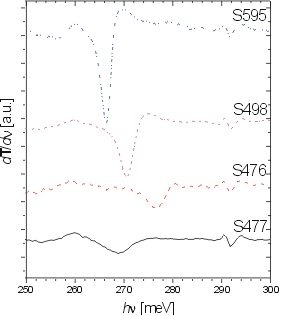
By differentiating the zeroth order spectra, the exitonic transitions are enhanced above the
background signal as shown in the figure below.
In an intrisic system the exciton postion (energy) is determined by the band structure,
effective masses of the holes and electrons, strain induced by lattice mismatch of the barriers
and wells, width of the wells, band offsets and the thickness of the barriers. The width
of the excition is based soley on the lifetime. However, in an imperfect system there is
inhomogeneous broadning of the excitonic spectra which is governed by the variation in the
well width, alloy variations (impurities), roughness which may have a scale dependence and
strain variation from screw or threading dislocations.

|
Figure 1
First derivative FTIR transmission spectra using a 5 point Savitzky-Golay smoothing
algorithm showing the first heavy hole exciton absorption. The GaAs bulk absorption
peak shown at 292 meV was used to normalize the spectra.
|
| (click on image to enlarge) |
Comparison of 1st heavy hole excition transistions
| Sample |
Quantum Well
Structure |
Buffer
Thickness
[mm] |
Exciton
Energy
[meV] |
Exciton
FWHM
[meV] |
| S595 |
25 x
[25 nm InSb + 50 nm AlInSb] |
4.0 |
266.4 |
2.6 |
| S498 |
25 x
[25 nm InSb + 50 nm AlInSb] |
4.3 |
270.5 |
3.2 |
| S476 |
10 x
[25 nm InSb + 120 nm AlInSb] |
4.4 |
265.5 |
4.2 |
| S477 |
10 x
[25 nm InSb + 50 nm AlInSb] |
0.5 |
276.6 |
5.9 |
|
|


